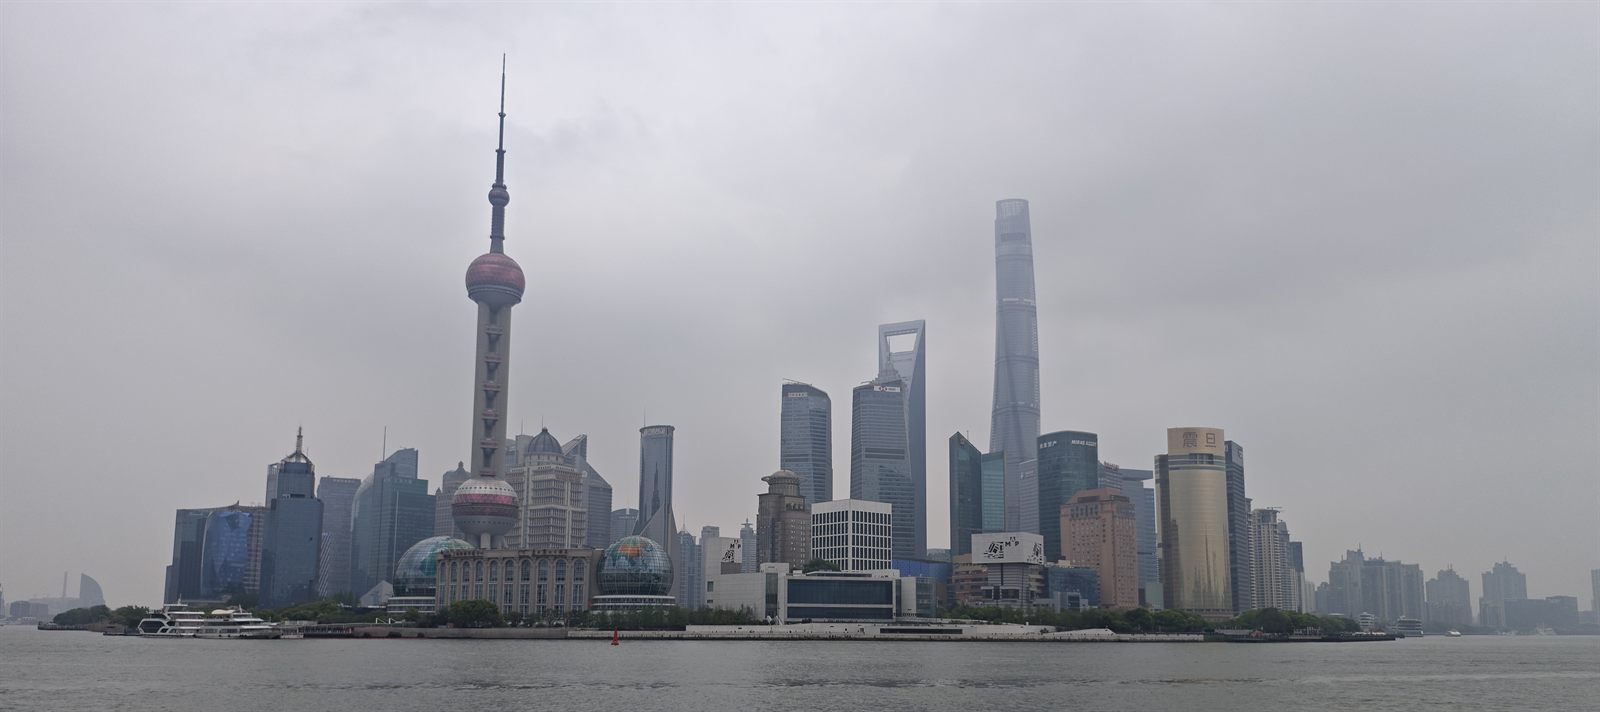
Where the manufacturing surplus is made and the technology fight is fought. Europe's sovereignty package is aimed here, the sanctions rerouting runs through here, and the region acts on the others more than it is acted upon — which is why the tension is rising rather than resolving.
Governance is not the fragile part here. China's state faces no electoral contest and keeps full policy control; Japan and South Korea are stable democracies. The strain is structural and economic — property investment down 18% year-to-date, weak domestic demand, and deflationary pressure a strong export book only partly masks. Above trend for the region's capacity to hold together under stress, marked down because the economic model is visibly straining rather than adjusting.
ECONOMY55
Strong by world standards, below trend by its own. China grew 4.3% year-on-year in Q2 2026 — the weakest quarter since the end of 2022, missing both the ~4.5% consensus and Beijing's target floor — with fixed-asset investment turning negative and retail sales barely positive. Held up by a resilient export machine (shipments up 27% in June and 17.6% across the first half) even through Iran-war shipping disruption, which is the region's whole character: it acts on the rest of this map more than it is acted upon. Below trend, not in distress.
CONFLICT RISK54
No active war, but the highest-stakes standoff on the map that is not yet one. Through mid-2026 China sailed its Fujian carrier through the Taiwan Strait and ran blockade-simulation drills, drawing a $25 billion Taiwan supplemental defence budget and first live HIMARS tests in response, while Japan raised defence spending — sustained high tension without a shot fired between the majors. Scored near the midpoint: materially above a region at peace, well below the Middle East's active war. Inverted scale — higher means more risk.
Our own considered read. Scored 0–100 against what is normal for this region — 50 is trend, not a global average. Conflict Risk is inverted: higher means more. No source publishes these three numbers; they are our synthesis of the indicators below, which are real and followable. Editorial judgment, and ours to defend. how we score
No trend arrows yet. The figures these replace were placeholders, so there is nothing honest to measure movement against — the previous number was not a worse reading, it was not a reading at all. Trends appear at the next assessment.
The clearest case for why a region cannot hold an Influence Score: the two largest actors here are strategic rivals. A single East Asia rating would average China's position with Japan's and produce a number describing no country on the map.
China76GLOBAL
The surplus itself — the overcapacity Europe's trade defence is written against, and the manufacturing base the rerouted Russian trade now runs into.
STRONGEST · ECONOMIC
Japan66GLOBAL
The technology position Europe wants and the alliance position the US relies on: strong where China is weakest, in materials and semiconductor equipment.
STRONGEST · TECHNOLOGY
United States89GLOBAL
Export controls and alliance architecture. Present as the party setting the limits rather than as a regional economy.
STRONGEST · TECHNOLOGY
The figures are each actor's global Influence Score, not their weight inside East Asia — we do not have that number and will not estimate one. What is specific to this region is why each power is here. how we score