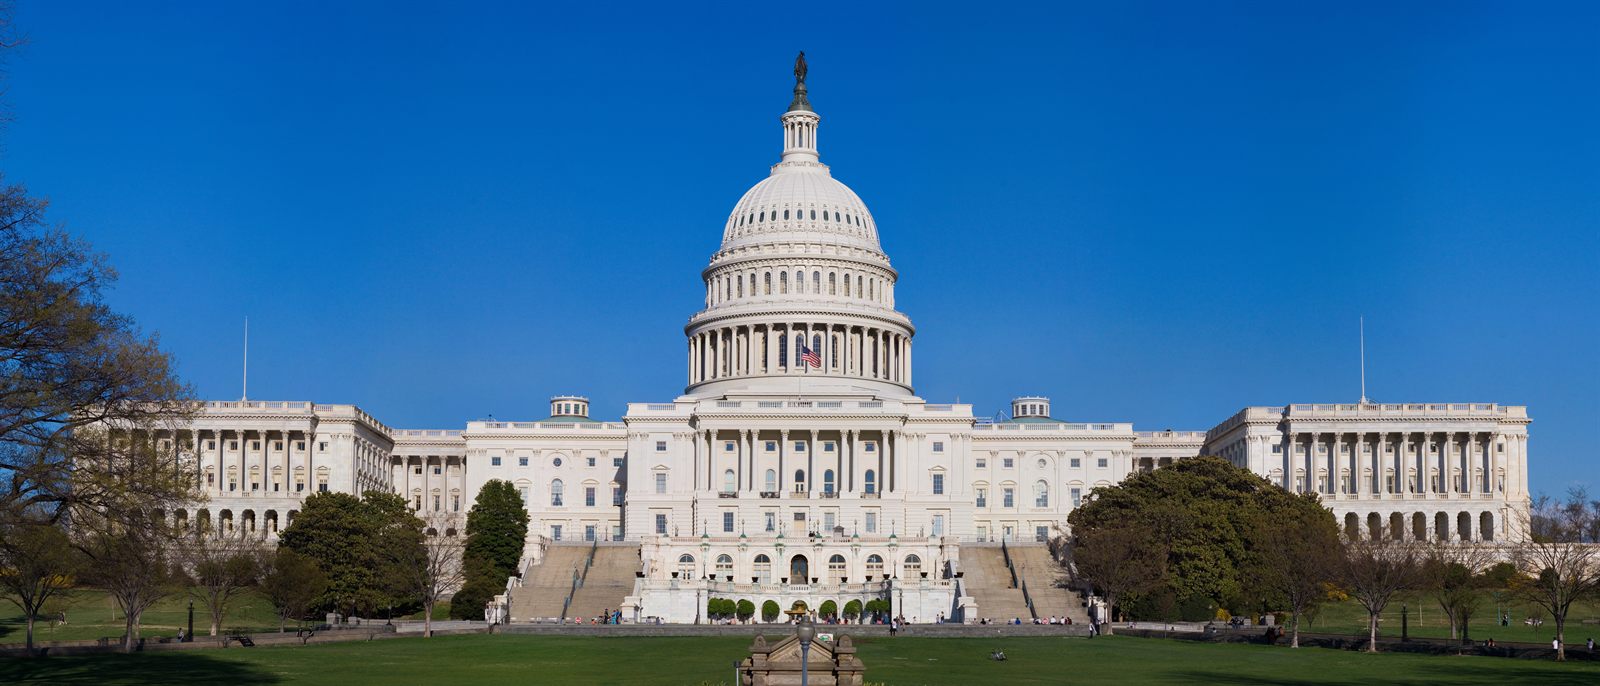
United States
The United States is the acting side of ten connections on the map — the sanctions chain, the US–Iran war it is fighting, the Taiwan arms package it is holding back as leverage against China, the raid that captured Venezuela's president, the tariff regime it has rebuilt twice since the Supreme Court struck it down, a new sanctions bill threatening 100% tariffs on Russia's biggest oil buyers, the decision to end legal protection for Haitians as gang rule spreads at home, its third Trump-Xi summit in eleven months, an unauthorized CIA raid in Mexico that killed two of its own officers, and the Western-backed rail corridor now racing China's own revived railway for Congo's copper and cobalt. Its larger presence is indirect: it is the supplier that replaced Russian gas in Europe, one of the exporters that absorbed the Hormuz closure, and the market whose rare-earth dependency China is quietly working — in none of those cases as an endpoint on the arc. It moves more of this map than it is drawn on.
→ China hub→ Middle East hubRSS feedOur own considered read. Scored 0–100 against what is normal for this region — 50 is trend, not a global average. Conflict Risk is inverted: higher means more. No source publishes these three numbers; they are our synthesis of the indicators below, which are real and followable. Editorial judgment, and ours to defend. how we score
No trend arrows yet. The figures these replace were placeholders, so there is nothing honest to measure movement against — the previous number was not a worse reading, it was not a reading at all. Trends appear at the next assessment.
Influence Meter
6 dimensions of powerThe ceiling this map's Influence Meter is calibrated against: the deepest capital markets, the largest defence budget, and the reserve currency every sanctions regime here is denominated in. Its one soft spot is the same one this hub's health read shows — an open-ended war with no clean exit.
Each axis is rated 0–100 against the other actors on this site, not against an absolute — the United States is the ceiling. The composite is a weighted average of the six. No source publishes these ratings; the formula is arithmetic, the numbers going into it are our editorial judgment. how we score
Active connections
Showing all 18 connections
What we intend to cover
Editorial intent, not findings. Nothing below has been analysed yet.
- LNG export capacity as the counterweight to pipeline leverage.
- Electoral cycles as a scheduling constraint on foreign policy.
Nothing here stands alone. This story is one node in a wider web — every card is another thread you can pull.